The municipal bond market faced significant volatility in April, driven by spillovers from a turbulent Treasury market. Treasury yields were pressured higher by rising inflation expectations; the Federal Reserve’s cautious policy stance, reduced foreign demand; hedge fund deleveraging, portfolio shifts toward cash, and structural illiquidity. These dynamics reverberated across fixed income markets, with municipals experiencing pronounced dislocations due to their fragmented market structure and liquidity constraints. High-grade (HG) municipal yields fluctuated sharply, with AAA benchmark yields traversing an 85-basis point (bps) range in long-end tenors. By month-end, yields ultimately rose by double-digit basis points across the muni curve. But with the dust mostly settled, in our view, value has returned to the muni market and not just for traditional muni buyers. Starting yields, which represent the best expectation of future returns, are above longer-term averages and are equally attractive relative to most taxable alternatives.
What Just Happened?
Conceptually, non-Treasury bond yields are a function of a Treasury yield component plus a spread component to compensate for additional risks (including credit and liquidity, to name a few important risks). So, as Treasury market volatility erupted last month, most other high-quality fixed income markets were negatively impacted as well, with the muni market, perhaps surprisingly, feeling the brunt of the Treasury market volatility. Investors appeared to be selling liquid holdings to seek refuge in cash until volatility subsided. However, the municipal market’s inherent illiquidity and fragmentation made this mass exodus particularly disruptive, amplifying spread widening beyond what might otherwise be expected.
Even before the Treasury volatility episode last month, munis had been underperforming taxable markets this year. Underperformance was mostly the result of onerous net supply, ETF outflows, and headline concerns about the removal of the tax-exemption status of munis. However, that was last month and with yields and spreads rerating higher, muni markets appear a lot more attractive to us than they did before the recent upheaval. But, as usual in the muni market, politics could get in the way of an attractive opportunity.
Tax Policy & Muni Exemption: The Key to Future Demand
Entering 2025, expected tax policy changes were a key focus, considering the new administration and the end-of year expiration of the individual tax cuts associated with the 2017 Tax Cuts and Jobs Act. It has been widely expected that the current tax regime would be either extended or lowered, considering the Republican majority in Congress. Surprisingly, this month, it has been reported that the White House has considered increasing the top individual marginal tax rate from 37% to 39.6% to offset the costs of other budgetary initiatives.
All else equal, a nearly 3% increase to the top tax bracket would significantly impact the relative value of municipal debt. Considering a new 43.4% top marginal tax rate (which includes the 3.8% surcharge associated with the Affordable Care Act), the investment-grade Bloomberg Municipal Bond Index taxable-equivalent yield-to-worst (YTW) would improve from its current 6.99% to 7.37%, a level that well exceeds the yield of the lowest investment grade (BBB) corporate index.
Also complicating the muni narrative is the potential for Congress to remove or alter the tax-exempt status of munis. However, the House Municipal Caucus — which enjoys broad bipartisan geographic representation from Republicans in both solidly red districts (Indiana, Texas) and purple districts (Pennsylvania, New York, California) — continues to push back against proposals to eliminate this feature. While total removal of the tax exemption is estimated to raise approximately $250 billion over 10 years, the secondary effects would likely increase borrowing costs for municipalities by 0.80% to 1.0% for higher-rated issuers and 1.0% to 2.0% for lower-rated issuers. And while outright elimination appears unlikely, the heightened media attention surrounding this possibility has understandably dampened demand. GOP leadership is asking committees involved in reconciliation to adhere to an extremely rapid markup schedule, with the plan to have a package on the House floor the week of May 19, according to recent press reports. In our view, this heightens the likelihood of municipal market volatility over the near term.
Valuations Are Attractive Versus History
On the positive side, starting yields remain quite attractive. With tax-equivalent yields (TEY) ranging from 7–9% (the high-quality Bloomberg Municipal Bond Index has a 6.99% TEY), we believe the value proposition for municipal bonds — particularly in the intermediate maturity category — remains compelling, though near-term volatility may persist.
Starting Yields are Attractive Relative to History
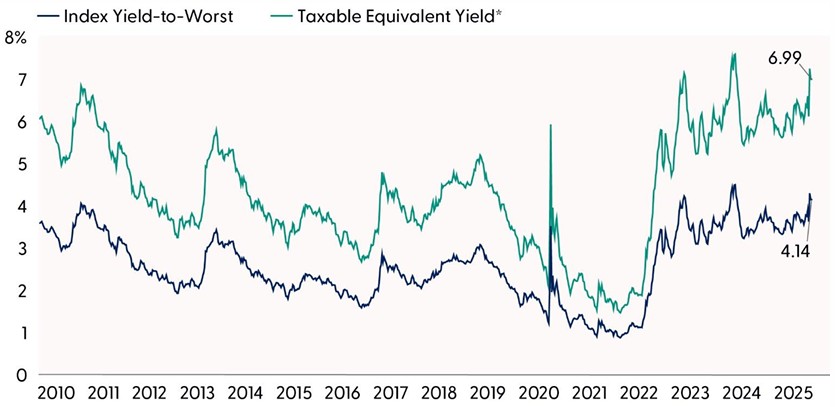
* Assumes tax rate of 40.8%
Source: LPL Research, Bloomberg 05/02/25
Disclosures: All indexes are unmanaged and cannot be invested directly. Past performance is no guarantee of future results.
Moreover, municipal bonds currently compare favorably versus both Treasuries and corporate bonds. Measured through yield ratios — the municipal yield divided by a Treasury or corporate yield of similar maturity — we’re seeing valuations that suggest attractive entry points.
The municipal-to-Treasury ratio has averaged around 65–85% historically, meaning municipalities typically yield about 65–85% of what comparable Treasuries yield before accounting for tax benefits. Current ratios stand near the top of these longer-term averages, indicating municipals are currently relatively inexpensive — and not just for high tax bracket investors. The municipal-to-corporate ratio tends to be lower (typically 60–65%) since corporate bonds carry elevated default risks and thus should offer higher yields compared to municipals. These favorable relative valuations suggest potential for increased “crossover” interest from non-traditional municipal investors, which would help support prices going forward. Banks and insurance companies, which are taxed at lower rates than individuals and are big buyers of munis when valuations are attractive, could be the marginal buyer for all the supply that is coming to market, which would be supportive of prices.
Munis Are Cheap Relative to Many Taxable Alternatives
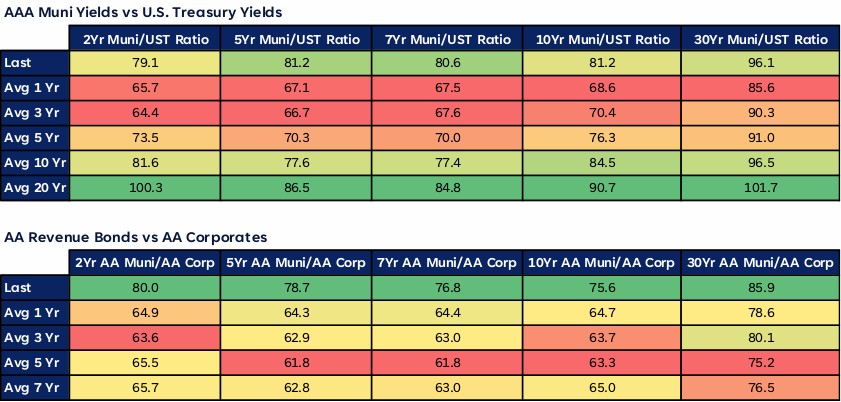
Source: LPL Research, Bloomberg 05/02/25
Disclosures: All indexes are unmanaged and cannot be invested directly. Past performance is no guarantee of future results.
Historical data supports a rebound following periods of underperformance as well (no guarantee though). When municipals lag Treasuries by 400 basis points over three months, as seen recently, the subsequent three-month excess return averages 150 basis points, driven by spread compression. With starting yields for munis attractive relative to history, as well as taxable alternatives, we think history could at least rhyme with spreads between munis and Treasuries compressing.
Muni Supply Outpacing Muni Demand
A large headwind to muni returns so far this year is the amount of supply coming to market. Municipalities, eager to term out debt, perhaps to front-run expected tax policy changes, have remained active issuers this year. While supply hit several records last year, total issuance is actually higher thus far this year. Total issuance of $43 billion in March was 15% higher than March 2024 levels. Moreover, year-to-date issuance of $182 billion now exceeds 2024’s record pace by 18%. The total muni market is only roughly $1.7 trillion (compared to over $7 trillion for the U.S. corporate bond market) and includes over 61,000 distinct issuers, so an increase in supply by the magnitude that we’ve seen over the past 16 months can be a sizable headwind if demand doesn’t increase commensurately, which unfortunately it hasn’t.
Issuance Trends Remain Above Historical Averages
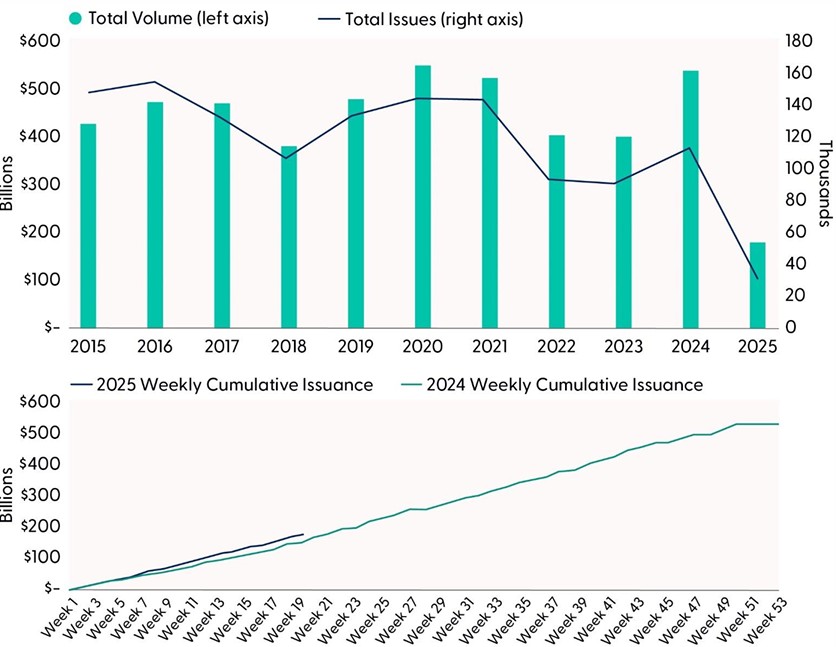
Source: LPL Research, Bloomberg 05/02/25
Disclosures: All indexes are unmanaged and cannot be invested in directly. Past performance is no guarantee of future results.
On the other side of the supply/demand dynamic, municipal demand softened during the month of March (latest data available) due to seasonal tax-related selling pressures. The Investment Company Institute (ICI) reported that March fund flows slowed to $252 million, including outflows toward month-end, down from $5.8 billion in February.
During the week ending April 23, though, weekly reporting municipal mutual funds recorded $397 million in net outflows, according to Lipper. Long-term funds recorded $1.1 billion in outflows; intermediate funds recorded $7 million in outflows, and high-yield funds recorded $142 million in outflows. Last week’s outflows marked the seventh consecutive week of net outflows and led year-to-date (YTD) inflows lower to $5 billion — some $177 billion short of the new supply that has come to market this year.’
Muni Fundamentals: Stable with Strong Default Characteristics
That said, in our view, fundamentals for most municipalities are still in good shape, so while downgrades could increase marginally due to the ongoing uncertainty in markets, we don’t envision a scenario where the recent volatility turns into something worse. The Census Bureau released updated state and local tax collection estimates recently, which indicated continued revenue growth for traditional municipalities. Calendar-year 2024 tax collections increased 4.5% to $2.1 trillion year-over-year (YoY), marking a record high level, according to Census data. Property tax collections also recorded a strong trend higher, growing 7.7% YoY. Strong fundamentals support an attractive risk-adjusted value proposition for the asset class.
And while last week’s GDP figure showed the economy contracted marginally during the first quarter, it was more noise than signal, with a large increase in imports that offset the still strong consumer. Nonetheless, we are in the camp that expects the U.S. economy to slow, but still grow this year, but uncertainty remains. If, by chance, the economy does contract, causing tax receipts to decline, muni defaults are likely to be less severe than what could take place in the corporate credit markets.
Muni bonds, in general, have better default characteristics than corporate bonds. Since 1970, the 10-year cumulative default rate for investment grade munis is barely above zero, whereas it was over 2% for similarly rated corporate bonds. Moreover, when compared to the riskier segments within the corporate credit universe, lower rated/high-yield munis enjoyed a default rate more than 75% less than corporate alternatives.
Munis Have Had Better Default Characteristics Than Corporates
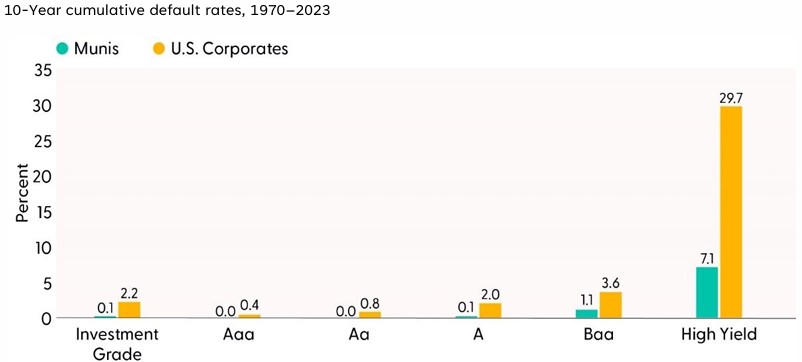
Source: LPL Research, Bloomberg, 05/02/25
Disclosures: All indexes are unmanaged and cannot be invested directly. Past performance is no guarantee of future results.
Conclusion
No doubt last month was a volatile month in the fixed income markets. But the positive news is that higher yields and wider spreads typically translate to better future returns. As such, we think the municipal bond market currently presents an attractive buying opportunity for strategic investors willing to navigate near-term volatility. The combination of historically attractive valuations, strong credit fundamentals, and the potential for enhanced tax benefits creates a compelling investment thesis.
Investors should consider the following approach:
- Extend duration selectively. Intermediate-maturity municipals (5–15 years) offer particularly attractive value in the current environment, balancing yield enhancement against potential rate volatility. The steepness of the municipal yield curve presents opportunities for strategic portfolio positioning.
- Focus on quality. While credit fundamentals remain solid across the municipal landscape, prioritize AA and A-rated issuers with stable revenue streams and strong reserves. This quality-focused approach provides resilience against potential economic deceleration while capturing attractive yields.
- Implement dollar-cost averaging. Given potential near-term volatility surrounding tax policy developments, phasing investments over the next 2–3 months may provide superior entry points while immediately beginning to capture elevated tax-equivalent yields.
- Leverage professional management. The current environment’s complexity — balancing credit quality, duration, and state-specific opportunities — makes professional management via high-quality mutual funds or separately managed accounts particularly valuable.
In summary, while short-term disruptions may persist, municipal bonds represent a rare opportunity to secure equity-like returns (on a tax equivalent basis) with significantly lower risk profiles and enhanced tax advantages.
Asset Allocation Insights
LPL’s Strategic and Tactical Asset Allocation Committee (STAAC) maintains its tactical neutral stance on equities, with a preference for the U.S. over emerging markets, growth over value, and large caps over small. After the latest stock market rebound, the Committee has not ruled out the possibility of a reversal lower due to trade uncertainty and slowing economic growth. LPL Research continues to monitor tariff news, economic data, earnings, the bond market, and various technical indicators to identify a potentially attractive entry point to add equities.
Within fixed income, the STAAC holds a neutral weight in core bonds, with a slight preference for mortgage-backed securities (MBS) over investment-grade corporates. In our view, the risk-reward for core bond sectors (U.S. Treasury, agency MBS, investment-grade corporates) is more attractive than plus sectors. We believe adding duration isn’t attractive at current levels, and the STAAC remains neutral relative to our benchmarks. And with the recent back-up in yields, municipal bonds, particularly within the intermediate category look attractive.
Important Disclosures
This material is for general information only and is not intended to provide specific advice or recommendations for any individual. There is no assurance that the views or strategies discussed are suitable for all investors or will yield positive outcomes. Investing involves risks including possible loss of principal. Any economic forecasts set forth may not develop as predicted and are subject to change.
References to markets, asset classes, and sectors are generally regarding the corresponding market index. Indexes are unmanaged statistical composites and cannot be invested into directly. Index performance is not indicative of the performance of any investment and do not reflect fees, expenses, or sales charges. All performance referenced is historical and is no guarantee of future results.
Any company names noted herein are for educational purposes only and not an indication of trading intent or a solicitation of their products or services. LPL Financial doesn’t provide research on individual equities.
All information is believed to be from reliable sources; however, LPL Financial makes no representation as to its completeness or accuracy.
All investing involves risk, including possible loss of principal.
US Treasuries may be considered “safe haven” investments but do carry some degree of risk including interest rate, credit, and market risk. Bonds are subject to market and interest rate risk if sold prior to maturity. Bond values will decline as interest rates rise and bonds are subject to availability and change in price.
The Standard & Poor’s 500 Index (S&P500) is a capitalization-weighted index of 500 stocks designed to measure performance of the broad domestic economy through changes in the aggregate market value of 500 stocks representing all major industries.
The PE ratio (price-to-earnings ratio) is a measure of the price paid for a share relative to the annual net income or profit earned by the firm per share. It is a financial ratio used for valuation: a higher PE ratio means that investors are paying more for each unit of net income, so the stock is more expensive compared to one with a lower PE ratio.
Earnings per share (EPS) is the portion of a company’s profit allocated to each outstanding share of common stock. EPS serves as an indicator of a company’s profitability. Earnings per share is generally considered to be the single most important variable in determining a share’s price. It is also a major component used to calculate the price-to-earnings valuation ratio.
All index data from FactSet or Bloomberg.
This research material has been prepared by LPL Financial LLC.
Not Insured by FDIC/NCUA or Any Other Government Agency | Not Bank/Credit Union Guaranteed | Not Bank/Credit Union Deposits or Obligations | May Lose Value
For public use.
Member FINRA/SIPC.
RES-0004065-0425 Tracking #733231 | #733233 (Exp. 05/26)